Competitive outcome
Points
460 points or moreclubs out of 18
740 to 59 pointsclubs out of 18
7Fewer than 40 pointsclubs out of 18
Pre-registered rule · A single outcome indicator limits the weight of performance in the analysis.
 Ligue 1 · 2025/26
Data investigation · 2025/26 season
The geography of club profiles in 2025/26


Alphabetical list. Club order and position do not indicate league rank, geography or MCA coordinates.
18 clubs. 7 characteristics. Another way to read Ligue 1.
Alphabetical order · non-analytical positions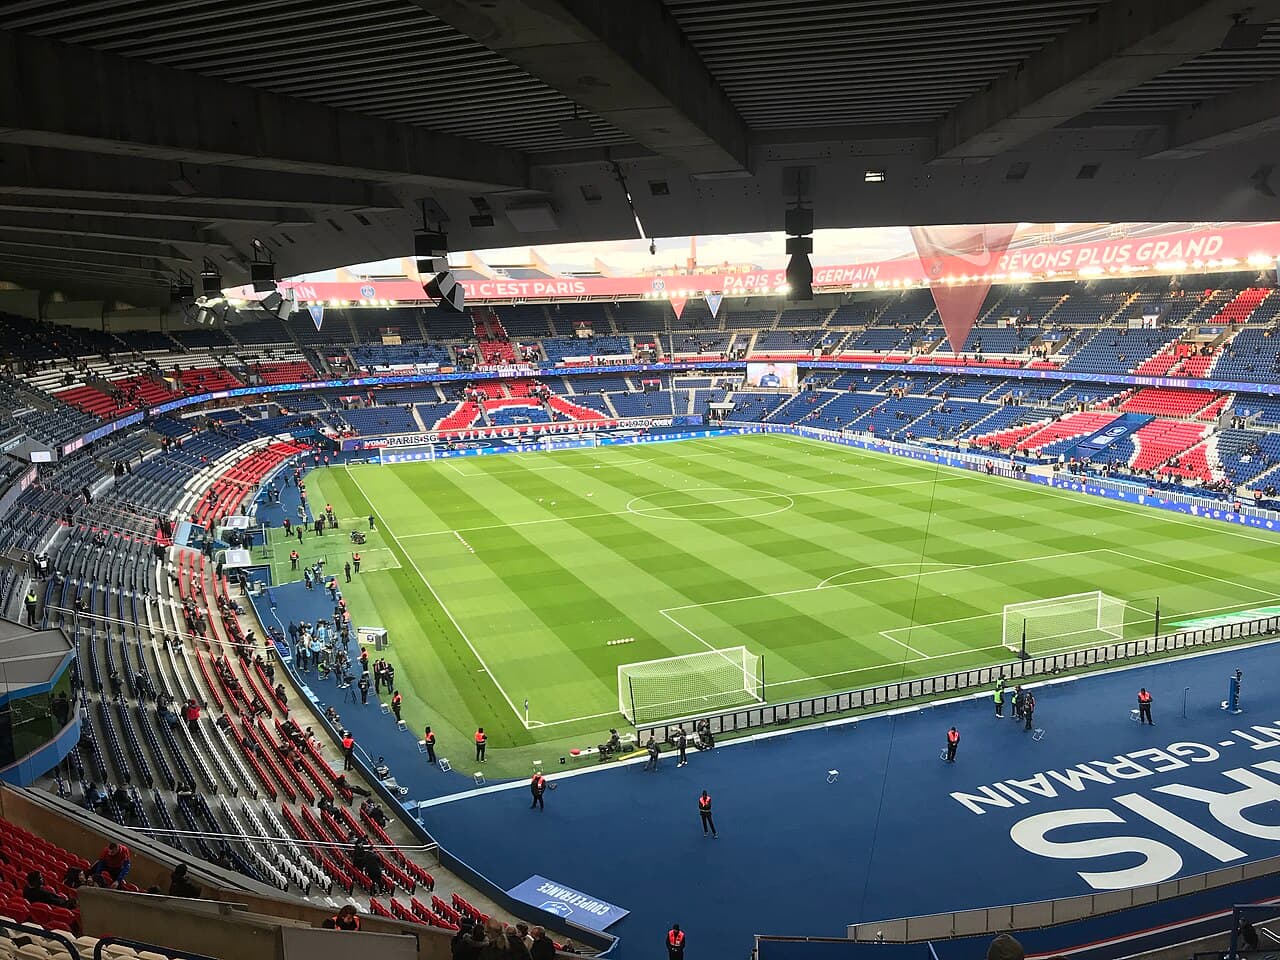
From faces to the league
A football scene invites us in. Then the view widens: the analysis is structured by the profiles of all eighteen clubs in 2025/26, not by the photographed players.
The present
The league table is already creating a sense of urgency. What if we began with what it leaves out?
As of 21 September, the first five matchdays of the 2026/27 Ligue 1 season had been completed; Matchday 6 is scheduled for 9–11 October. This current-season context is strictly editorial: the analysis uses 2025/26 data exclusively.
Those opening weeks give the league immediacy, but they do not yet provide the depth needed for a structural reading. Our starting point is therefore a question, not a result: before asking who will finish where, what distinguishes the clubs’ profiles?
Sources for the current context
The field of inquiry
The league table summarises a season. On its own, it cannot describe the combinations of performance, possession, attacking production, defence, contact and European context that distinguish clubs.
The scope
A structural view requires a completed season and a complete universe.
The investigation returns to 2025/26: a completed season with 18 clubs observed on the same basis. They form the entire analytical population, not a sample selected to serve the narrative.
The 2026/27 season appears in the opening as editorial context. It enters neither the modalities, the coordinates nor the MCA. This separation is a visible methodological rule, not a qualification hidden in a footnote.
The characteristics
A competitive outcome alone does not show how a club uses possession, creates chances or defends.
Points summarise the season outcome. Possession helps describe how a club uses the ball. xG describes expected attacking production; goals conceded, the defensive outcome. Interceptions document a defensive process, fouls committed a volume of contact, and UEFA participation provides European context — nothing more.
Each measure was converted into categories using thresholds fixed before MCA. These 19 modalities make profiles comparable, while discarding differences that remain within each band.
Thresholds and roles were pre-registered before MCA. They preserve ties, but categorisation loses information within each band.
Competitive outcome
Pre-registered rule · A single outcome indicator limits the weight of performance in the analysis.
Possession / build-up
Pre-registered rule · Rounded public percentage; the 50% boundary is preserved as registered.
Attacking process
Pre-registered rule · Expected attacking production across the season under the provider model.
Defensive outcome
Pre-registered rule · A defensive-outcome indicator, kept distinct from defensive mechanisms.
Defensive process
Pre-registered rule · A higher volume of actions does not automatically mean better defending.
Contact volume
Pre-registered rule · A neutral contact-volume measure, not aggression.
European context
Pre-registered rule · Participation in 2025/26 only; it does not measure prestige, wealth or quality.
Before the map
The first associations appear pair by pair, with signals of different intensity.
Cramér’s V summarises the strength of the observed relationship between two categorical variables. A larger value means their distributions depart further from what we would expect without association; on its own, it indicates no direction, establishes no causality and offers no football explanation.
In this season, points–possession and possession–xG are among the stronger signals. Yet all 21 tables are sparse. The results are exploratory: they guide the MCA reading, but they do not deliver a verdict.
The printed number and pattern density encode the same value. A crossed cell means corrected V equals zero, not proven independence.
| PTS | POS | xG | GA | INT | FLS | UEFA |
|---|---|---|---|---|---|---|
| PTSPoints | ||||||
| POSAverage possession | 0.77 | |||||
| xGExpected goals (xG) | 0.43 | 0.76 | ||||
| GAGoals conceded | 0.59 | 0.33 | 0.00 | |||
| INTInterceptions | 0.00 | 0.35 | 0.00 | 0.00 | ||
| FLSFouls committed | 0.00 | 0.00 | 0.00 | 0.00 | 0.00 | |
| UEFAUEFA participation | 0.34 | 0.53 | 0.63 | 0.00 | 0.31 | 0.00 |
Pair by pair, relationships emerge.
MCA asks what happens when these categorical relationships are considered together.The method
Because associations are not limited to pairs: they intersect within the same clubs.
Each club is an observation. For every characteristic, it belongs to one modality. Multiple Correspondence Analysis places clubs and modalities in a common geometry to summarise the combinations that structure the whole league.
The map does not rank clubs, calculate a quality score or predict results. Projected proximity is not sufficient proof of similarity: coordinates, contributions, cos² and the underlying modalities must be read together.
The 18 clubs, each defined by one modality for each characteristic.
The 19 active modalities that construct the axes.
Coordinates and distances that summarise profiles, not a hierarchy.
The map positions combinations of modalities. It does not rank club quality.
This axis notably combines possession, xG, points and UEFA participation. It describes a profile contrast, not quality.
This axis mainly separates goals-conceded and points bands, with defensive actions and contact secondary.
The listed modalities support the pre-established interpretation. Contribution and quality of representation remain distinct.
Distance on the map is geometric. Interpretation depends on coordinates, contributions, cos² and the underlying categorical profiles.
Cos² indicates the quality of representation of a point on the selected plane. The 0.40 threshold is a reading aid, not a statistical test.
The first contrast
The principal contrast combines several aspects of play and outcome; it does not collapse them into a scale of “quality”.
The positive side notably contains the modalities for at least 50% possession, higher xG, higher points and UEFA participation. The negative side contains their lower bands and no UEFA participation.
The axis therefore describes a possession, attacking-production and season-outcome profile. UEFA participation is contextual only: it measures neither wealth nor prestige and establishes no causal relationship. Interception volume also contributes, preventing a one-note reading.
Interceptions also contribute; UEFA participation remains strictly contextual.
Return to the map ↗The second contrast
The second axis adds configurations of goals conceded, points and defensive activity to the reading of the first.
One side is built mainly by the lower goals-conceded band and the higher points band. The other brings out the intermediate goals-conceded, points and xG bands. Interceptions and fouls committed complete the configuration.
Calling it simply “defensive quality” would mislead. Defensive actions may also reflect exposure or match context, while fouls measure contact volume here — not aggression. This is a composite contrast, not a defensive rating.
It is not a ‘defensive quality’ axis, and only six clubs have Dimension 2 cos² of at least 0.20.
Return to the map ↗Additional view
Pairwise association support is limited; this remains a secondary axis.
Return to the map ↗D4 reveals only weak residual structure: it remains in the methodology, not the main narrative.
Editorial reference points · final 2025/26 table
The top four finishers in 2025/26 make the geography more concrete — without becoming four categories.
PSG, Lens, LOSC and Lyon appear in final-table order. Their selection is editorial: it was not produced by MCA and does not define groups, models or archetypes.
Each reference point is read through its coordinates, the modalities associated with the seven active characteristics and its cos², all drawn from the analysis. All eighteen clubs remain on the map, and no crest replaces an analytical point.
Editorial order: final 2025/26 table. Equal visual weight for all four clubs.
Final 2025/26 position1st place
On D1 × D2, Paris lies on the positive side of both axes. Active modalities and cos² provide context for that position, not a superiority score.
Final 2025/26 position2nd place
Lens also lies on the positive side of D1 and D2. The principal plane does not exhaust its profile: active modalities and representation quality remain essential.
Final 2025/26 position3rd place
LOSC lies on the positive side of D1 and D2. This descriptive reading rests on its coordinates, active modalities and quality of representation on the plane.
Final 2025/26 position4th place
Lyon lies on the positive side of D1 and D2. This reference remains strictly descriptive: coordinates, active modalities and cos², without extrapolating beyond the analysis.
Focused reading · 2025/26 evidence
First- and second-place finishers in the final table, within a space built from all eighteen clubs.
MCA coordinates · D1 × D2
Final 2025/26 position · 1st place
Final 2025/26 position · 2nd place
On D1 × D2, both clubs lie on the positive side of each axis, without occupying the same position. The quality of representation on the main plane is higher for Paris than for Lens: cos² reminds us that a projection does not show an entire profile.
The league table summarises the season’s competitive outcome. MCA describes associations among the selected modalities. This reading remains descriptive and exploratory: projected proximity proves neither overall resemblance nor causation.
Return to the 18-club map ↗The caution
A projection becomes more useful when its losses and uncertainties remain visible.
The D1 × D2 plane represents 46.56% of raw inertia. The remaining structure does not disappear: some clubs and modalities are better represented on D3, while cos² signals what the plane shows well — or poorly.
The population contains only 18 clubs. Thresholds turn continuous values into categories; public possession is rounded; every contingency table is sparse. Sensitivity analyses support some readings without making the geometry invariant. Nothing here establishes causality.
The hypothesis tested
The analysis qualified the original hypothesis instead of trying to confirm it.
The principal contrast is clear, but it does not create two sealed camps. Some clubs occupy intermediate positions; others differ more on D2 or D3; some apparent proximity on the principal plane weakens once projection quality is considered.
The most faithful reading is a continuum of overlapping profiles shaped by several defensive and contact configurations. MCA is not a classification algorithm: it does not decide how many club “types” exist.
The takeaway
The league table orders a season. The map reveals the characteristics that tend to vary together.
In 2025/26, Ligue 1’s main structure was organised around possession, attacking production and season outcome. Defensive outcome, defensive actions and contact revealed other directions that prevent a binary reading.
Looking beyond the league table does not replace it. It changes the question: not only “where did the club finish?”, but “which associations make up its profile?”
Methodology
The method summarises associations between modalities. It produces neither a ranking, a rigid typology nor a causal explanation.
The population contains every club from the 2025/26 Ligue 1 season. The 2026/27 season serves only as editorial context and remains outside the analysis.
The active variables cover outcome, possession, attacking production, defensive outcome, a defensive process, contact and UEFA context.
Thresholds and roles were pre-registered before MCA. They preserve ties, but categorisation loses information within each band.
Bias-corrected Cramér’s V describes the strength of a relationship between two categorical variables. Every table is sparse, so no result is treated as causal proof.
MCA begins with the complete disjunctive table. Clubs are observations; active modalities construct the axes. Python generates the coordinates, which are never recalculated in the browser.
A coordinate locates an element. Contribution shows what constructs an axis. Cos² indicates the quality of representation of an element on the plane. No diagnostic is sufficient on its own.
D1 × D2 is the entry plane. D1 × D3 and D2 × D3 recover some defensive and contact structure. D4 remains secondary.
Pre-registered alternative thresholds and leave-one-club-out runs assess sensitivity without replacing the primary analysis.
The small population, categorisation, rounded possession, sparse tables, partial projection and absence of variables on squad composition or physical attributes limit the scope of the conclusions.
The corrections change the shares of inertia to be interpreted, but never the primary MCA coordinates. Corrected percentages must not be confused with raw inertia.
| Dimension | Raw inertia | Benzécri correction | Greenacre adjustment |
|---|---|---|---|
| D1 | 29.4% | 78.6% | 64.6% |
| D2 | 17.1% | 13.6% | 11.1% |
| D3 | 14.8% | 7.4% | 6.1% |
| D4 | 9.8% | 0.4% | 0.3% |
Official source
Analytical data comes from the sources documented in the methodology and analytical process. Raw LFP data remains outside public content until reuse is authorised.
Raw LFP tables are not distributed. For local review, the site uses an analytical dataset limited to what is strictly necessary; publication remains subject to rights verification.